Summary
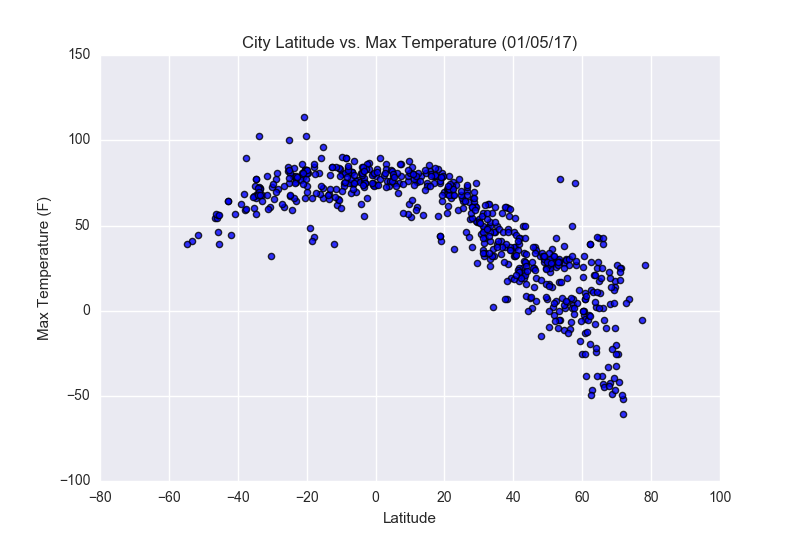
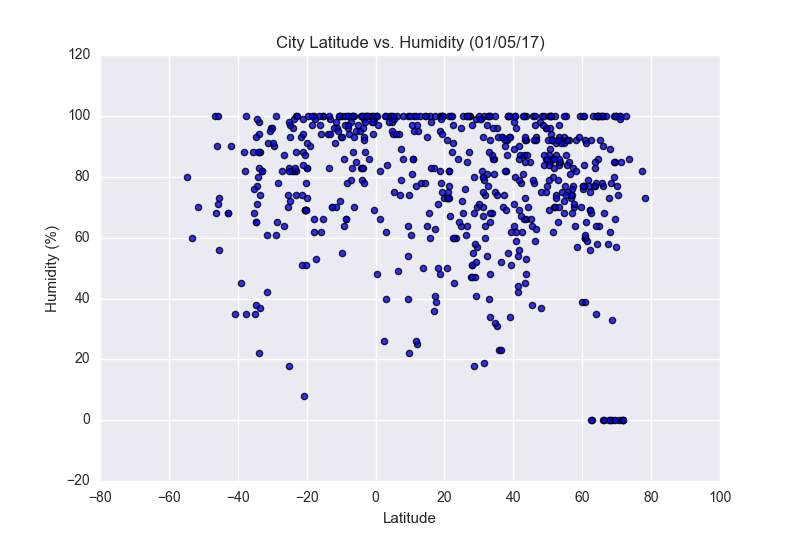
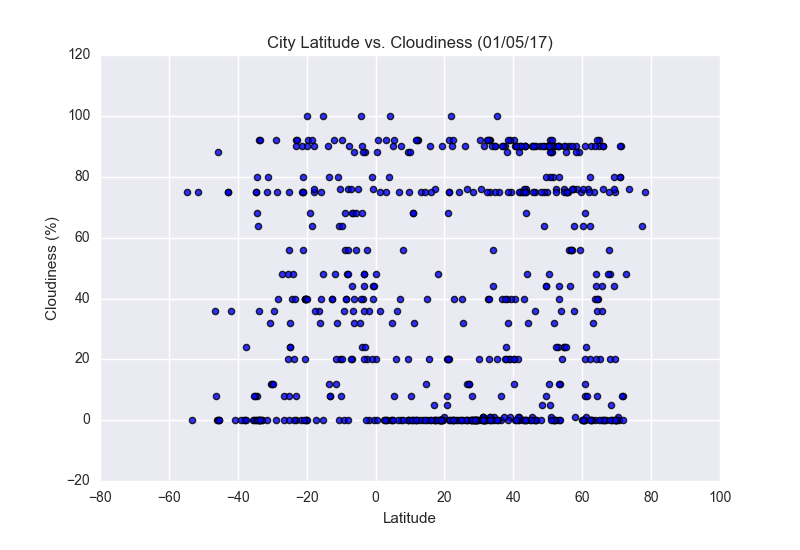
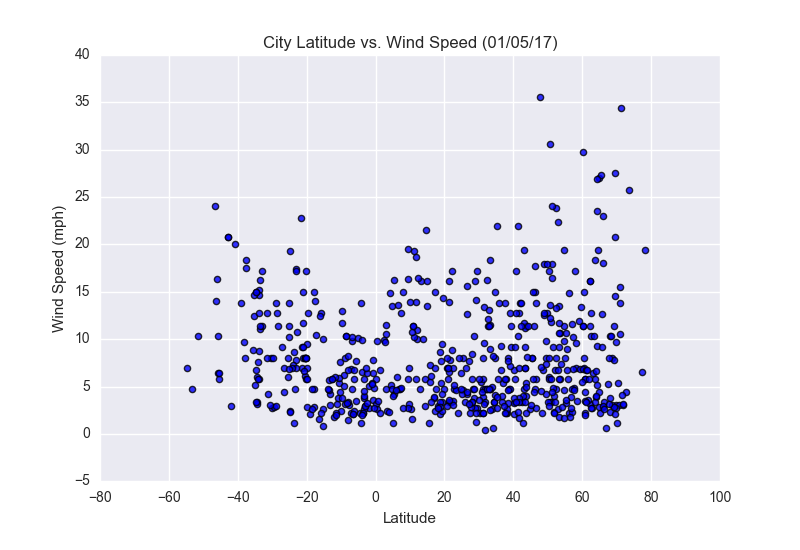
Data analytics is a powerful process used to find patterns in large sets of data. In this instance, python Matplotlib was used to analyze data pulled from the OpenWeatherMap API. The specific weather categories analyzed were temperature, cloudiness, wind speed, and humidity. The data was graphed using matplotlib to visualize the patterns and correlations between weather and latitude.